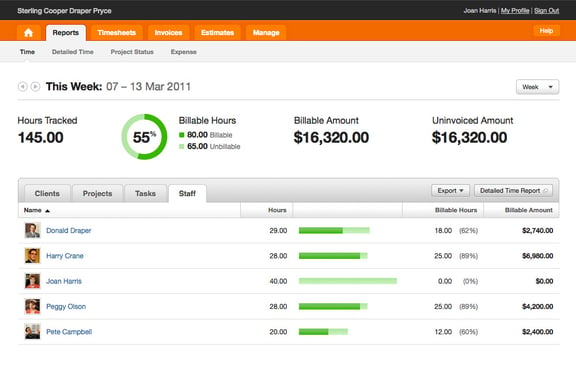
It’s arrived! Welcome to the brand new Harvest Time Report:
A redesign of the Time Report has been a long time coming. Reports need to effectively present the overwhelming amount of data your company enters every day, in a format that’s easy to analyze and understand. At its core, the Time Report is a decision-making tool. We want Harvest to help you make better decisions and the new version of Reports was designed with this in mind.
Here are a few of the enhancements in the new Time Report:
Easy to Scan
The new interface is designed to make it easy to understand the overall health of your business. We’ve added a summary panel at the top of the page that quickly shows you the big picture: total hours, billable percentage, billable amount, and uninvoiced amount. Details of this summary are displayed in a table organized by Clients, Projects, Tasks, and Staff. This layout will help you find what you need fast.

Staff Report
How staff spend their time is one of the most important pieces of information for any company, so we’ve added a Staff Report as a way to access this data easily. Decision makers can view staff members’ total billable and unbillable hours, or click on a specific staff member and find information on all of the Projects and Tasks they worked on. You can also upload their photo, making it even faster to relate hours to a person on the report.
5x Faster
Underneath the new Time Report interface, the entire reporting codebase was rewritten from the ground up. Our development team took advantage of the recent Rails3 upgrade, and the rewritten code is 63% smaller than the original. With the updated interface and navigation structure, there’s less data to render for each page load, and together with the more efficient code, the new Time Report is five times faster than the original reports on initial load.
Other Goodies
We’ve also incorporated a number of special additions and frequently requested features to make Reports more useful:
- You can now filter Reports by a “semimonthly” timeframe, so if you bill from the 1st to mid-month and from mid-month to the last day, this filter is for you.
- We’ve added more graphs, including a color-coded bar graph to help you quickly compare the time spent on your top tasks.
- Tabs are loaded via AJAX for more responsive navigation (as well as faster initial rendering).
- We took full advantage of our recent Harvest HD upgrade, minimizing images and utilizing all new CSS3 techniques. This means pages load extremely fast.
What’s Next
This feature took us 451.10 billable hours.We’re extremely excited about the new Time Report, and we hope you find it useful for your own business. We’re happy to announce that this is only the first in a series of updates coming to Reports in the future. Stay tuned for major improvements to the Detailed Time Report, Exporting, the Project Status Report and more.
Enjoy the new Harvest Time Report, and let us know what you think!


